Performance Modelling for DevOps
Performance Modelling for DevOps: Integrating APM+Performance Modelling for DevOps, Paul Brebner
I hadn't come across WORP before and it turns out to be a rather odd beast in some ways. It's run by practitioners for practitioners, is invitation only based on submitting an Abstract (which I had done), and has a limit of about 20 people and a rather formalised (in 1 sense) organisation which uses K-cards to ask questions. On the other hand it is more informal (but more "controlled") than a typical academic workshop. I assumed that by receiving an invitation I was being asked to present my presentation. However, I was unable to clarify this via email prior to the workshop. There is also no official programme (so you can't check that you are have a speaking slot), and as it turns out no guaranteed order or length of time for presentations or questions. Presentations can take from 10 minutes to 1/2 a day and questions and discussion the rest of the day. Altogether a very odd experience. Also no official publications resulting from the presentations. However, lots of interesting people and plenty of opportunity to have real discussions in the breaks and over beer (lots of nice beer tasting in Wellington). Mainly Americans and NZ'ers (2 Aussi's) if you count me. I used the new direct flight from Canberra to Wellington which made it feel like a domestic flight (just don't forgot your passport).
The presentation is mainly the slides, I've added some text for context but was planning on ad-libbing it.
I'm a boat person

50 years ago I sailed from England to NZ on a boat. We even brought our own car! Oh, not that one, another English made car (Morris 1100. I was still driving it went off to Waikato University in 1980).

It took 6 weeks via the Panama Canal and Tahiti. I arrived in Wellington harbour almost exactly 50 years ago (Feb 1967, I still have my Father's passport that I travelled on). I recently worked out that he had spent 12 months on boats going backwards and forwards from England to NZ over his lifetime. That's leisure for you! He spent his time playing competitions of deck quoits. This is how it was done on the Royal Yacht Britannia!

And I like Models (not the above sort)
When I was a kid I remember a special shopping trip to Wellington to buy model knights. Here are similar ones (I still have a collection of these which I bought on ebay as an adult as I'd lost the originals).

As a kid I got hours of enjoyment playing with my model knights. This was fine as a kid but what's an adult version? Replica armour! This is full size, battle ready. It's the real thing.Actually I bought a piece every Xmas for my son but he had to grow into it (it weighs about 20kg). This photo is similar (it's middle medieval so still has some chain mail).

Or is it still a model? Not sure I really want to find out in a battle with sharpened swords. Or jousting!

My first real computer science job was again in Wellington at the of my 1st year at Waikato university. My job was for a data logging company and I had to speed up the program that ran the sensor to speed up measurement of rain drops for a science experiment to measure the density of raindrops in clouds. Cool. First example of Cloud Computing??? This is a special type of cloud formation (also from NZ :-)

Fast forward a "few" years to Canberra. This year there was a cool exhibition at the National Museum called the history of the world in 100 objects, from the British Museum in London (which I used to visit regularly in 2004 as UCL had a private back entrance). I had a season pass and visited about 10 times (most times with guests). It's hard to pick a favourite object from 100 but I liked this one.

It's an Astrolabe, used for navigation using the sun and stars etc. It' actually a model of our bit of the universe. I was curious and bought a similar device called a Planisphere (flat sphere). This is it.
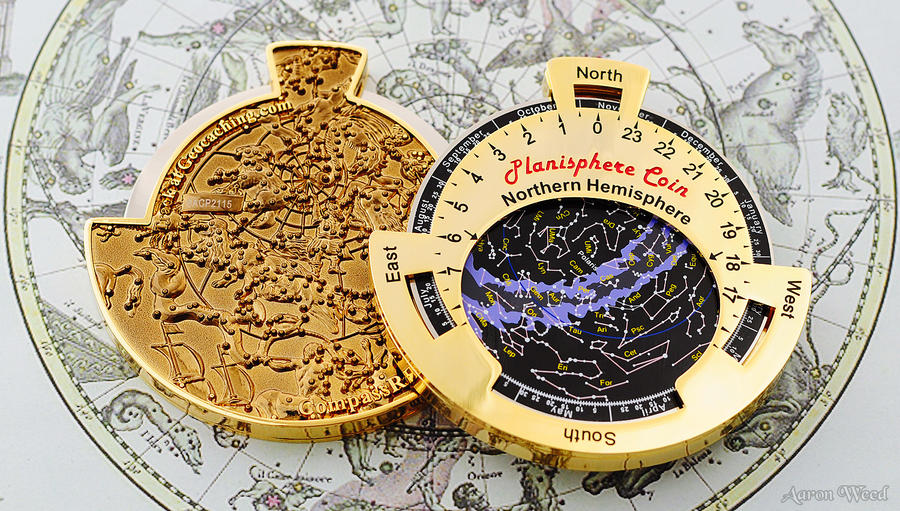
It's a really nice "toy" made of brass and very detailed. Mine is the Southern Hemisphere version.
In theory they are only accurate for a limited range of latitudes. The model in the exhibit came with multiple plates for different latitudes. I was going to pass mine around so people could play with it.
How does it work? It’s a model of the motions of the “celestial sphere” - stars, earth and sun. It simplifies things (e.g. 3d stars and earth to 2d disk), but results in distortion and approximation.

It's calibrated for particular latitude (southern hemisphere). Given any 3 of date, time, orientation, and which stars are visible and where in sky you can work out the missing one. Used for navigation.
So it's not just a toy/model. This is a particularly good example of when a model is better than the real thing. The classic case is a map, as full sized 1:1 scale map is really completely useless – it's not portable or predictive (e.g. for navigation etc) – maybe with computer version this isn’t true anymore?
Back to my boat trip. The boat (the Rangitane) took 6 weeks, and 400 passengers (single "Class"!) What's the Throughput of the boat? Using Little's Law (Concurrency = Time x Throughput) that 67 people per week (10/day, 0.4/hour). This is a trivial example. What if you have multiple ships? Different types of transportation? For more complex systems you need more sophisticated approaches and tools. Particularly if you want to model more than "average" metrics. Modelling is used a lot for real-work engineering problems. E.g. Science, engineering, traffic, the weather, cars, etc. Why not so much in software systems? Modelling has evolved from simple maths to Queue networks, more complex maths, discrete event simulation, and modelling and tool support for s/w systems (e.g. layered queue networks, PCM, etc).

This brings us to my performance modelling approach. Since 2007 project in NICTA to develop tools to assist mostly government systems of systems to perform better in advance. It's a Service Oriented Performance Modelling tool: Model driven (SOA performance meta model), GUI (browser), SaaS.
It enables modelling at level of workloads, composite and simple services, servers. Simulation for metric prediction (RT, TP, Concurrency, Server Utilisation). Used during early, middle, later lifecycle for lots of real systems.
BUT Manual model building (structure, parameterisation, calibration) is: Time consuming, Expensive, Error prone, Limited model complexity that can be built manually, Not easily repeatable or maintainable, Not accurate enough for some problems (need high quality and quantity of performance data), Not fast enough for agile development.
Last 3 years we have been a start up company, have to make $$$$$$. Most customers have APM products. So the solution is to use automatic model building from APM data. Cheaper and faster and more accurate, and solves new problems, e.g. DevOps.
Automatic performance modelling from APM data
Only use APM data.
Automatically build, parameterise and calibrate the performance model from the APM data.
Multiple model types with various trade-offs, accuracy for capacity/response times, and model complexity/ability to change model aspects.
Currently different model types are produced as part of the APM -> modelling tool transformation phase. Here's the overview of the main components and types of models.

Models are built from Dynatrace data. Here's a Transaction Flow dashboard which shows the main components.

From which we can produce a "simple" capacity model in our SaaS tool.

Here's the Dynatrace PurePath (detailed transactional data) dashboard.

From which we can produce a detailed transactional model. I.e. each transaction type has the complete call-tree to each component, times, and servers. This is only a portion of the model.

Models are useful for exploring changes: Manual vs. Automatic model changes.
Manual model changes e.g.
- Different alternative architectures (e.g. centralised, hierarchical, p2p)
- Architectural changes
- New transaction types and services added
- Different workloads (arrival rate, transaction mix)
- Replacement of services (same service replaced by external provider)
- Migration of part/all of hardware (e.g. legacy to cloud, cloud to in-house, mainframe to cluster)
- Performance problem diagnosis and impact of possible fixes
Automatic model changes (target is Ops and DevOps)
- DevOps (e.g. new R services added)
- Change in workload (e.g. previous peak, forecast peak, actual and theoretical worst case transaction mix)
- Change in data resulting in new model (e.g. capacity model over time)
We can model changes to: APM data Simple capacity model – changes to APM data over time resulting in model changes

And changes to: Code. E.g. Recent DevOps project.
Devops
- Focus on response time SLAs
- Deployment/resources
- Faster cycle time (takes months from Dev->Test-Prod)
Challenge
- In-house APM tool
- “Profile point” times only
- Main contact was with testing team, not much contact with development or operational staff.
What changes can be modelled?
Changes to the analytics services (R):
- Heavily used
- Multiple services
- New services added all the time
- Services had different time and memory profiles
- Would a new service break the SLA?
- Which server should it be deployed to?
- Baseline model accurate to 10% response time provided good starting point for modelling impact of changes
The baseline production model result predicted RT @ 95% of 1.4s.

With a new "R" service (data analytics) service added, the 95% RT is predicted to be 1.5s.(not much increase so all ok).

Deployment Optimisation
A more interesting/complex problem was deployment modelling (where to put services)!

Optimising deployment of services to multiple servers taking into account memory and CPU usage, frequency and response time. Where to put new services (and if existing services should be re-deployed):
- 4 services out of 30 used 50% of CPU
- A type of box/bin packing problem
- Initially on 2 servers, but target was 3 servers as number of R services increased (replicated for HA)
- Approach
- Bin packing algorithms to explore several different heuristic solutions
- Then modelled best results to check that capacity and response times ok for realistic load/transaction mix
- For each new service which server should it be deployed to?
Shift Left/Shift Right (DevOps)


In Melbourne you have to turn right from the left lane. Why? Otherwise you will probably DIE! as the trams will run smack into you. For DevOps what does this mean?
Existing Dev, Test, Prod lifecycle: Delays in feedback: Takes weeks per iteration, test environment is a bottleneck, environments are different:

DevOps + APM: earlier but not completely accurate performance feedback:

DevOps + APM + Modelling: Earlier more accurate performance predictions -> decreased cycle time:

Although in practice there is extra complexity, for example multiple developers result in multiple (concurrent) changes needing to be measured and modelled:

Some Challenges
- Calibration of performance models for use in Dev from Test and Prod
- Lots of developers and changes to subsets of code, can we capture, measure and model all types of changes?
- Micro-services architecture may be a realistic starting point?
- What about changes to infrastructure code that could impact multiple services?
- What DevOps tool support is required to automate everything? Does it exist? Is anyone using it?
- Are there any DevOps testbeds available for experimentation?
- One idea is to use performance models as testbed, easy to change parts of system, generate example transaction data, re-model with that data, and loop.
Performance Modelling + APM for Dynatrace?
Andi Grabner (Dynatrace) gave a talk at WOPR25 on using APM for DevOps for Dynatrace's own DevOps and deployment process for their SaaS version (AWS). The only problem was that due to a change in a library they didn't catch a performance impact in advance. As a result they have a bill-shock when they received a bill 4x higher than normal due to the combination of the workloads, deployment software and the changed library. I had a chat to Andi's afterwards and we think this would be a good application of an integration of performance modelling with APM as it would have allowed prior modelling of the impact of all 3 aspects to predict the increase in resource usage and therefore cost change in advance of deployment.
PS1
During a break from the workshop I went up on the famous cable car for a walk around the botanical gardens. There is an observatory at the top which has a dome which used to house a very large Astrolabe: a DANJON IMPERSONAL ASTROLABE! Up until the age of the GPS this location was the most precisely known location NZ! The dome was originally used for a rangefinder for a disappearing gun nearby (location 2 in image after this one).
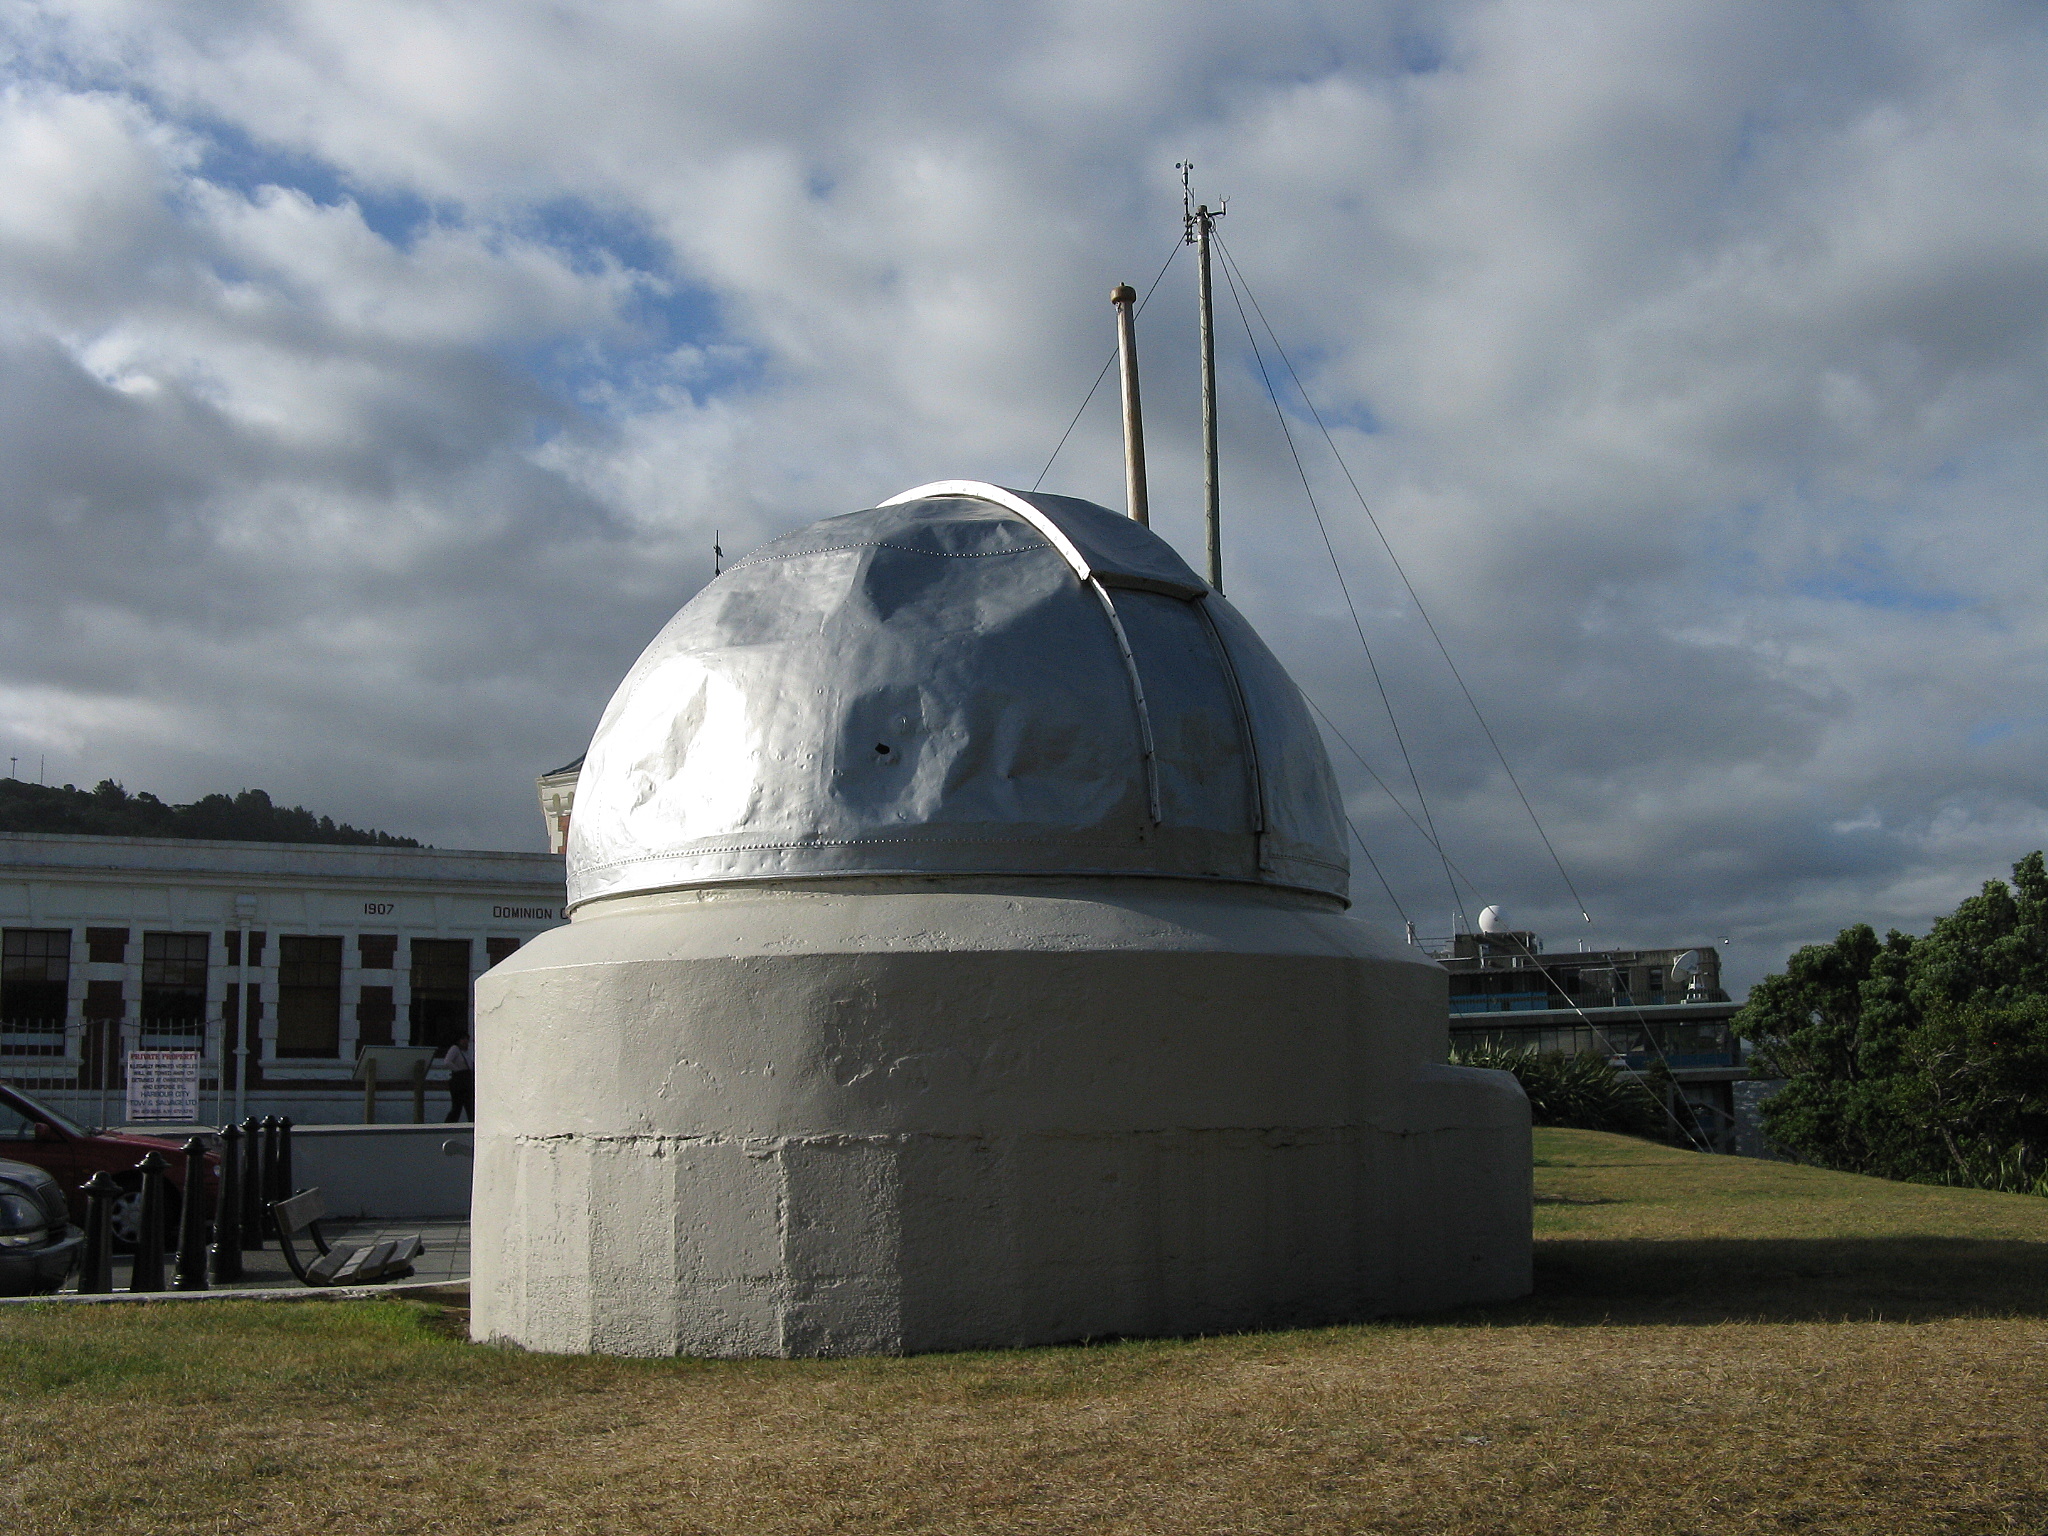

During a break from the workshop I went up on the famous cable car for a walk around the botanical gardens. There is an observatory at the top which has a dome which used to house a very large Astrolabe: a DANJON IMPERSONAL ASTROLABE! Up until the age of the GPS this location was the most precisely known location NZ! The dome was originally used for a rangefinder for a disappearing gun nearby (location 2 in image after this one).


This is an awesome post. Really very informative and creative contents. These concept is a good way to enhance the knowledge on DevOps.
ReplyDeleteBest Regards,
CourseIng - DevOps Training in Hyderabad
Superb post. Thanks for sharing.
ReplyDeleteDevOps course in Pune